by Corey Desormeaux , Staff Writer, All Habs Hockey Magazine

OTTAWA, ON. — The Montreal Canadiens are on to the second round of the Stanley Cup Playoffs after defeating the Ottawa Senators in six games. After a 3-0 series lead, the Habs dropped two games in a row before closing out the series Sunday night. The series was physical, fast and full of emotion. It was an intense ride for fans of both teams, with all but two of the games (nearly one if not for the empty netter in game six) being decided by one goal. From a statistical perspective, the series was extremely close.
| Goals For | Scoring Chances | Corsi For (5vs5) | Fenwick For (5vs5) | |
| Montreal | 12 | 160 | 304 | 220 |
| Ottawa | 12 | 155 | 300 | 209 |
(statistics from war-on-ice.com)
Let’s take a look at one statistic from each game that, from my perspective, really stood out.
Game 1 – MTL (4) OTT (3)
Jeff Petry led all Habs defencemen with 56 per cent Corsi at even strength.
Already missing their top goal-scorer, Max Pacioretty, with an upper-body injury, the Habs were forced to play over half the game without P.K. Subban. Subban was ejected for slashing, forcing the Canadiens to finish the game with five defencemen. Jeff Petry stepped up his game big-time.
The reason this statistic is so impressive is that no Habs defencemen was close to that number. In fact, none of the other four defencemen finished the game above 50 per cent.
- Tom Gilbert – 39%
- Nathan Beaulieu – 41%
- Andrei Markov – 49%
- Alexei Emelin – 46%
Jeff Petry proved that he can remain an effective player with added responsibility.
Game 2 – MTL (3) OTT (2)
David Desharnais had the most favourable deployment at even strength. Comparing offensive vs. defensive zone starts, Desharnais started 71.43 per cent of his faceoffs in the offensive zone in Game 2.
Despite such a favorable deployment, Desharnais only managed to register one shot on a goal and failed to register a scoring chance. To be fair, Desharnais is notorious for not shooting the puck, but his linemates didn’t fair much better. Devante Smith-Pelly registered just one shot on goal and two scoring chances and Max Pacioretty tallied two shots and two scoring chances.
Brendan Gallagher on the other hand, registered seven scoring chances despite an unfavourable deployment. Gallagher’s fraction of offensive zone starts vs. defensive zone starts at even strength was 27.27 per cent.
If Desharnais is deployed like a first line centreman, he has to begin producing like one.
Game 3 – MTL (2) OTT (1)
P.K. Subban played over 33 minutes in this game, more than any other player on either team.
This statistic is important because although Subban was held off the scoresheet, he proved yet again that he is a responsible and reliable defenceman. P.K. is a workhorse. His work ethic and desire to learn has helped him gain the trust of Michel Therrien over the years. He plays in all situations, the power-play, penalty kill and a bulk of the even strength minutes.
In Game 3, P.K. led all defencemen from both Ottawa and Montreal in Corsi differential (+14), shots (8), and when at even strength, had the least favourable deployment, only starting 28.8 per cent of his faceoffs in the offensive zone.
Game 4 – MTL (0) OTT (1)
Tom Gilbert’s Corsi at even strength was 6 per cent.
That’s an unfortunate number for Gilbert, who I thought had a good series in all but one of the games. That bad game was this one.
Gilbert struggled to get the puck out of the defensive zone all night, and looked strangely out of position in the Habs end of the ice.
To be fair to Gilbert, he had two different defence partners in the series. For the first three games it was Nathan Beaulieu, and for the last three games it was Greg Pateryn. It may have just been a mixture of having an off night and adjusting to playing with Pateryn in his first NHL playoff game.
Gilbert finished the series with a Corsi of 46.49 per cent at even strength, higher than Alexei Elemin (45.33%) who has the luxury of playing with Jeff Petry (53.02%.)
Game 5 – MTL (1) OTT (5)
Lars Eller played 13:50.
Lars Eller has been one of the Canadiens’ best players throughout the playoffs and needs to be used more effectively. Eller managed to put five shot attempts towards the net, good for second among Habs forwards in this game.
Torrey Mitchell played 49 seconds less than Eller, finishing the game a minus-2 and only attempting one shot. This was by far Mitchell’s worst game of the series but it didn’t stop Therrien from using him nearly as much as he did Eller.
David Desharnais played nearly a full two minutes more than Lars Eller, two of them on the power-play and somehow, couldn’t manage to register a shot attempt.
Michel Therrien may want to think about using Eller’s puck control, pursuit and offensive skill on the powerplay.
Game 6 – MTL (2) OTT (0)
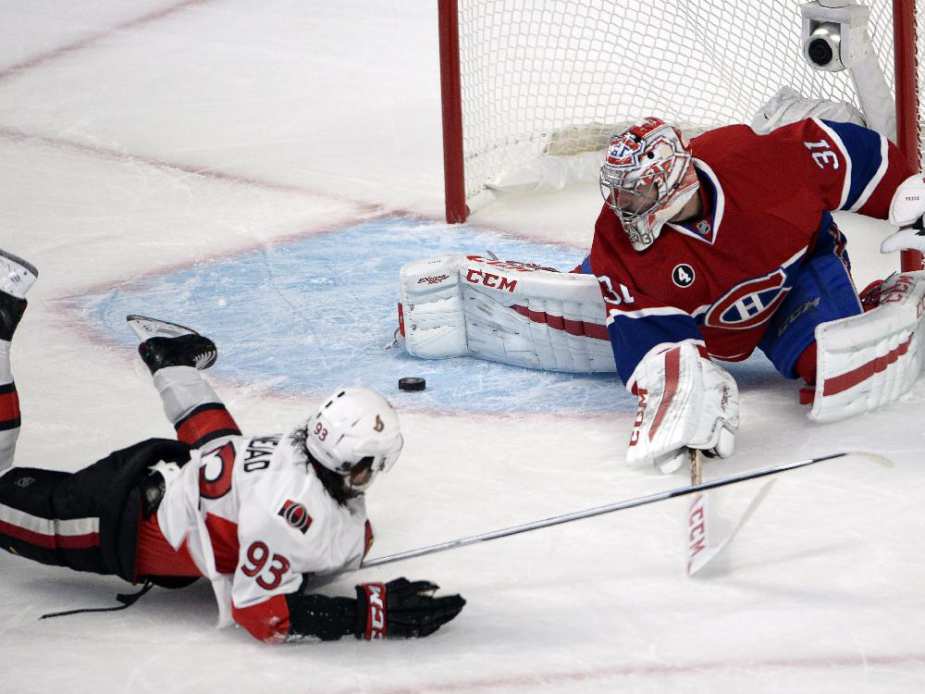
The Ottawa Senators had not been shutout in the 2014-’15 season until game six of the Stanley Cup Playoffs, their 88th game of the year.
Like it or not, this is how the Canadiens have chosen to win games all season long. Habs fans have seen this version of Carey Price all year, and yet again, on a bigger stage, under a lot of pressure, he proved why he is a Vezina trophy finalist and furthered his bid for the Hart trophy.
Peppered by 43 shots, Carey Price was the best Canadien, as he almost always is.
Comments are closed.